Monday, October 22, 2012

Iolite Community Development

*** Updated with interference goodness! ***

Seeing as it's been a while since we last posted to the blog, we thought it'd be a good idea to point out that the Iolite team aren't the only ones working on Iolite. There are others who are improving Iolite by adding their own features to make their data reduction easier or better in some way. Here's just a couple of examples:

Interference Calculator

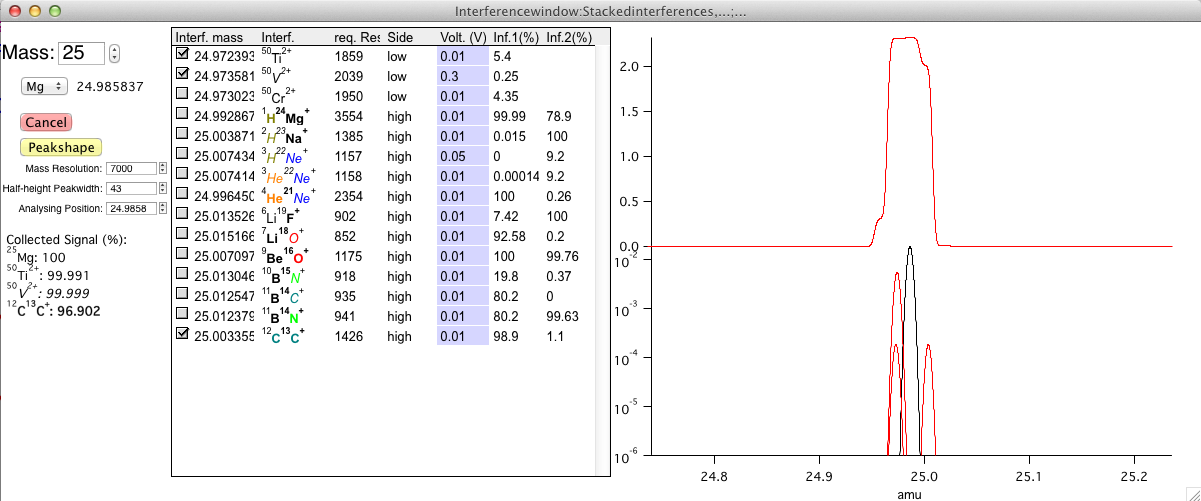
Knowing what possible interferences may affect your data can be difficult to keep track off if you analyse a variety of matrix types. Some mass spectrometers come with software that lists interferences, but what if you're processing your data away from the mass spec? What if you'd like to know what resolution you'd need to resolve an interference? Well, Martin Schiller from StarPlan in Copenhagen (with others) has written an AddOn for Iolite that will give you all sorts of information about possible interferences for a given mass. It even plots the interferences with your isotope of interest in a 'Faraday view" which is a really neat way of visualising it. Check out this post for more details.


Keep Notes with a Notebook:

If you find yourself trying lots of different approaches during your data reduction, or even if you'd just like to note down what variables you've used, Iolite has you covered thanks to the AddOn written by John Creech from Victoria University. In this post, he describes how you can add a menu item to the Iolite menu which will pop up a notebook window where you can write in all your data reduction notes. Since is stays with the experiment (that is, within the .pxp file) it's always there when you're looking at your data, even if you move the experiment between computers or even send it to your collaborators. I've started using it and I think it's very handy.


VizualAge

One of the most popular uses of Iolite is its U-Pb data reduction abilities. This has been expanded upon by Joe Petrus at Laurentian University who wrote VizualAge. If you don't know about VizualAge, you should check out the paper they published in the latest issue of Geostandards and Geoanalytical Research:

Petrus, J.A. & Kamber, B.S. (2012) VizualAge: a novel approach to laser ablation ICPMS U-Pb geochronology data reduction. Geostandards and Geoanalytical Research 36, 3 p. 247-269.

It's a pretty large paper and full of examples. Well worth a read. You can download VizualAge from Joe's webpage here.


Log Data Reader

A lot of analysts are realising how important metadata are. Instrument settings like vacuum pressure readings, lens settings and gas flows can all influence the quality of our data. The trouble is, they can be hard to keep track of, even if they are recorded in a human readable format. One step towards being able to evaluate your metadata along with your measurements is the Log Data Reader AddOn written by Martin Schiller and John Creech. So far it can read Nu Plasma and Thermo log files. Check out this post for more info.

That's just the tip of the iceberg. If you have written any additional code snippets to help you while using Iolite, we encourage you to post them to the forum where others can use them, and possibly even build on them too.


Iolite: upcoming developments

Meanwhile, Chad and I are busy working on core developments for Iolite. We're looking at some pretty fundamental changes that will probably be released as Iolite version 3. This will include upgrades to raw data importers, some really nifty improvements to how time resolved data are treated by Iolite, and a whole new user interface. Iolite v3 is a little way off, but in the meantime, we'll be releasing importers for Spectro machines and the iCAP Q, and a deconvolution tool we're writing a paper on, a new laser mapping procedure (previewed at the IGC conference in Brisbane in August), along with a few other data visualisation tools, and the usual bug fixes.

Don't forget that we're hoping to run a workshop at the Goldschmidt conference in Florence Italy in 2013, which will run over one and a half days. Hopefully this will give us enough time to take users from absolute beginners to confident gurus, with plenty of example applications.

As always, if you have any questions or comments, feel free to start a new topic on the Iolite forum.


The Iolite Team

Thursday, April 26, 2012

CellSpace images tutorial

The Iolite team and Ash Norris from Resonetics have been working on a new way of creating images. We take the spatial information recorded in laser log files and combine that with mass spec data to produce images of composition versus sampling position in the laser cell. This has some great advantages:
-images don't need to be of regular shape;
-image scans don't have to be sequential (so you can measure your reference materials between scans, or several times over the course of collecting an image);
-and, you can plot your laser ablation image over mapped images of your sample collected by other means, such as photomicrographs, SEM images etc.

Here's a tutorial, using an otolith (part of a fish's auditory system) to illustrate how to create a CellSpace image, and how it can be displayed over another image. You can download the example files from this page (at the bottom) to follow along. And if you're not familiar with using laser log files, you might want to visit this page first.

[Note: Aglient users may have issues synching the example laser log file and Agilent data. If so, please delete the AgilentDateFormat.txt file in the "Other Files" subfolder within your Iolite folder and try importing the example data again.]

And just to illustrate how this approach can save time, here's a figure of how the image scan lines were arranged (green lines in right-most image) over the otolith (shown without scan lines on left and center). You can see we mostly avoid the epoxy mount, saving time and reducing the amount of gunk put into the mass spec:


Unfortunately the mouse position was not captured very well by the recording software. If you have any questions, feel free to post on the forum.

Wednesday, March 21, 2012

Programming Basics for Iolite

We're getting a lot of users that want to customise the way Iolite processes their data, which is really exciting as it's exactly why we built Iolite in the way that we did. But we realise that there may be many more that just find getting into the programming code a little too intimidating, or that have started to take a look but would like a few more tips.

So the aim of this post is to give a really basic introduction to how to read and understand the programming code in Iolite – it's aimed at someone with no experience with programming, so hopefully it will give confidence to those people wanting to start looking at the code behind a DRS.

The first step is to find the programming code for a DRS. To do this, go to the Iolite dropdown menu and select "Edit the active data reduction scheme" (note that you need to have a DRS selected prior to doing this). If you'd like to make changes to a DRS we'd recommend making your own DRS so that you can keep the original – the easiest way to do this is by activating a DRS that you'd like to use as a template, then selecting "Create a new data reduction scheme" from the Iolite dropdown.

Once you've selected "Edit the active data reduction scheme" a window should pop up containing the programming code. The first thing you'll notice is that it's quite colourful - this is some helpful colour coding to make it easier to identify different types of things in the text.


Red text contains comments, which don't actually do anything except explain what the code is doing. You'll notice that all comments are preceded by "//", this is IgorPro's way of identifying comments in the text, so if you put "//" anywhere on a line then everything to the right of it will be ignored by IgorPro. This is of course really useful for anyone wanting to explain what lines or sections of code do. Obviously good commenting is therefore fundamental to making code that someone else can easily read and understand.

Blue text can be thought of as defining concrete things, like functions, strings, variables and waves.

Green text indicates something that will be printed, either in the history window, a popup window or on a graph. Green text is always bounded by quotation marks.

Black text is normal text, so if you write a simple equation or refer to things (e.g., a variable) that already exist then these will be black.

There are some other colours (e.g. the purple at the top of the window), but the main colours are those listed above

Another visual aid is indentation, which is a way of denoting increasingly local code. So a first level of indentation may be for all text within a function, then a further level within that may be for a loop that runs within the function, and maybe even a 3rd level of indentation (for example if there's an "if" statement within the loop).

Igor Pro has fantastic help for programming, and instead of attempting to describe things like loops and "if" statements I'd recommend using the built-in help. To do this is really simple, just right click on anything you'd like to know more about and select "Help for …..". This right-click menu also has some other great features, like the ability to insert a template for a function, which makes it much easier to use the correct syntax.

Having said that, here's a very quick summary of the main objects you'll want to use:

String = stores text
Variable = stores a number
Wave = stores a list of numbers (or text). Waves can be thought of as a single column in a table, or a line graph. Things can get pretty complicated once waves are involved, but we've done our best to keep things simple in the DRS code, and in most cases you can operate with a wave in a very similar fashion to a variable.

It's also important to think about the order that things are laid out. When Igor Pro executes the code it runs down the code one line at a time, so things have to be laid out vertically in the order that you want them to happen (although this simple flow may look more complicated once things like loops are involved). For a given line equations are read using normal mathematical hierarchy, regardless of the order things are laid out in, so brackets will be multiplication before addition, etc.

Some programming languages are case sensitive, so a variable called "Bob" would be different to another called "bob", but Igor Pro isn't like that. You can vary between upper and lower case in the code and it generally won't make any difference. Similarly, the code isn't sensitive to spaces or blank lines, so both "X = 2 + 5" and "X= 2+5" will give the same answer (an exception to both of these things is green text - it's sensitive to both capitals and spaces).

Finally, it's handy to know that things need to be defined prior to using them. For example, if you want to store a number you can do this in a "variable", but you'll need to let Igor Pro know that you'd like to make a variable and what name it should have.
 
In a similar way, instead of creating something, you could just make a connection to something that already exists. For example, if you want to perform calculations on a wave that already exists you would need to give it a label in the function, in combination with telling Igor Pro where it's located (there's an Iolite function called "IoliteDFPath" for making the location part easy).


So, hopefully the above basic bits and pieces will help a few more people venture into the DRS code, even if it's just to have a look around. And of course there is a huge amount of detail not covered here, so if you have any questions, whether very basic or more advanced, feel free to ask us on the forum and we'll do our best to help.

Happy programming!

Wednesday, November 30, 2011

How to add more globals to a DRS


This is just a quick tutorial to show you how to add more global variables or global strings to a DRS. These globals are useful because they're acessible via the Edit Settings window, which means that people not comfortable with the code can quickly and easily view and modify them (e.g., the "ReferenceStandard" global string). These globals are given a default setting in the header of the DRS, which is used every time a new experiment is opened. If a user decides that they don't want to change the setting in the experiment they're working in then they do this via the "Edit Settings" window.

Below is an image of the header text in the Trace_Elements DRS.

To add a new global is pretty straightforward. First, you need to make a new line in the DRS header - the easiest way to do this is to copy an existing line of the header. Pick a GlobalVariable if you want to store a number, or GlobalString if you want to store text (in most cases you'll want to use a variable).
Put the newly copied line directly beneath the line that says "//**** Any global strings or variables you wish to use in addition to those above can be placed here", like this:
Now change the name to what you'd like to use (make sure it doesn't start with a number, isn't more than 30 characters long, and contains no spaces or special characters), and input your default value (or string):
Now we're done with the header text, and for the next step you'll need to look a little lower in the DRS for these lines:
All you need to do here is add your item to the "NVar" list if it's a GlobalVariable, or the "SVar" list if it's a Global String. Make sure you add a comma prior to your item, and that the name is identical to what you put in the line above (copy and paste is the best way to ensure this). Here's my example added to the list of variables:
Now you're all done. To use the global variable within the DRS just use it like a normal variable, e.g.:
Just note that for the change to take effect in any existing experiments you have you'll need to go to the Iolite menu and choose "Update old experiment" so that the new global gets detected by the system.
And remember, if you want to change the setting for your global, you should do this via the Edit Settings window. The header of the DRS stores the default value, which will only be read in at the beginning of a new experiment.

If you have any questions then just post a question on the forum.


Tuesday, November 22, 2011

Uncertainty propagation - how it works

We've had a bit of interest in propagation of uncertainties in Iolite, so I thought I'd try to do two things in this post and the next.

In this post, I'll have a go at describing our protocol for propagating uncertainties. There is a description of the method in Paton et al. (2010), but I'll give a more detailed description here with more pictures in the hope that it may further clarify it.

Then I'll follow this up in the next post by describing how to implement the protocols. Many people may not realise it, but the functions in Iolite are free for anyone to plug into their own DRS, so I'll outline how to do this, and a few things to keep an eye out for in the process.

Monday, October 31, 2011

Using splines in a DRS

In this post I'm going to give a description of how someone making or modifying a DRS can take advantage of the DRS support functions included in Iolite for working with splines. I'll use the existing "Sr_isotopes_REE" DRS as an example - it's distributed with Iolite, which should make life easy for anyone that wants to use it as a template.
The below image is all of the lines of code required – thanks to Iolite's built in DRS support functions things are kept pretty short and simple…


Before I start on the nitty gritty, there's one important detail that I think is important to understand about splines. They are made and updated by the underlying Iolite code, not the DRS. It is possible to prompt Iolite to update splines, but you won't actually be making them in the DRS. Instead, the aim in the DRS is to implement splines that already exist.

So, presumably if you're at the stage where you're trying to use splines you know the basics of editing a DRS, so I'll skip to the particulars. Firstly, you need to make sure that the wave you're interested in has a spline. In order to be splined, your wave has to be in a list of channels, so make sure that you've added it to one, e.g.:


One other thing is worth noting, and that is that only pre-defined standards (i.e., those that pop up in the list of integrations) and the Baseline_1 integration type will be splined. Output_1, and any integration types you make yourself will never get a spline.
Now, to check whether the spline you're interested in exists, you should use the function:


A couple of things are worth noting about the above function. Firstly, it looks only at the integration type that you specify, so it will not consider other integration types (in the above example I've used the Global String from the header of the DRS called ReferenceStandard, but you could put something else in there. like "G_NIST612").
The first thing that the function does is check whether the spline exists. If it doesn't then it will stop the DRS and report in the history window to let you know what happened. If this happens, everything above that line in the DRS will have been done as per usual, but nothing below that point will have been calculated.
If the spline does exist then the function will try to make sure that all other splines for that integration type are properly built and ready to use.

Ok, now that we know the spline we're interested in exists, we need to make it accessible for use in the DRS. The reason for this is that splines can have a variable number of points, depending on what type of spline they are, and the spacing of the points in the wave will not match the spacing of the Index_Time wave. The following function is used to interpolate the spline onto the Index_Time wave, after which it can be used like any other wave in the DRS:


As with the MakeIoliteWave function, you can choose whatever name for the wave that you feel is appropriate("StdSpline_Sr87_86" in this case), just be sure to keep their length <20 characters, as longer than this can potentially cause bugs. Now you have the same spline that you would see in the graph display (e.g., the main control window) available as a regular wave. Assuming that you want to normalise using the spline, the next step is to get a value for your reference standard. You can just hardwire in a value, but if you want to get more sophisticated you can also pull the value from the standard file. This way, as the reference standard is changed, your DRS will automatically use the appropriate value. To do this, you can use the following function:


This line will create a variable with the name you choose ("StdValue_Sr87_86" in this case) and get the value from the standard's text file. Just keep in mind that the name you provide needs to exactly match that in the text file ("87Sr/86Sr" in this case). Ok, now we have all the pieces required, so it's time to make a wave to hold the normalised data:


And do the actual calculation


Now the channel of normalised data is ready, so the final step is to add the new channel to the list of output channels:


All done!

Saturday, October 22, 2011

Switching between DRS

The ease with which you can rapidly switch between different elements for internal standardisation and different reference materials for external calibration (see last post) is one of the great strengths of Iolite.

This can be extended to the DRS level too. If, for example, in addition to standard U-Pb geochronology, you wish to do some trace element analyses simultaneously on your zircon/monazite/etc grains this is straightforward. Just make sure that, during the analysis routine, in addition to the 91500 zircon (or whatever your favourite calibrant may be) you include a NIST glass or other reference material for the trace element calibration. Also, of course add an internal standard element such as Si to your zircon run routine in addition to any trace elements of interest.

Then, when it comes to crunching the data just use the U-Pb DRS as normal to process the analyses for age and export the data (the U-Pb DRS will ignore all the other information collected - it is only interested in the stuff required to do its own particular job). Then you can just switch to the Trace_Elements DRS and reprocess the data again for trace element abundances using the NIST glass as reference and Si as internal standard. These data can also be exported as usual.

You can save each 'process' as a separate experiment so it will be easy to go back and forth if you need to check anything or adjust parameters.

Those doing simultaneous U-Pb and Hf isotopes on MC-ICPMS should be able to do a similar thing i.e switch between U-Pb and Hf isotope DRS..